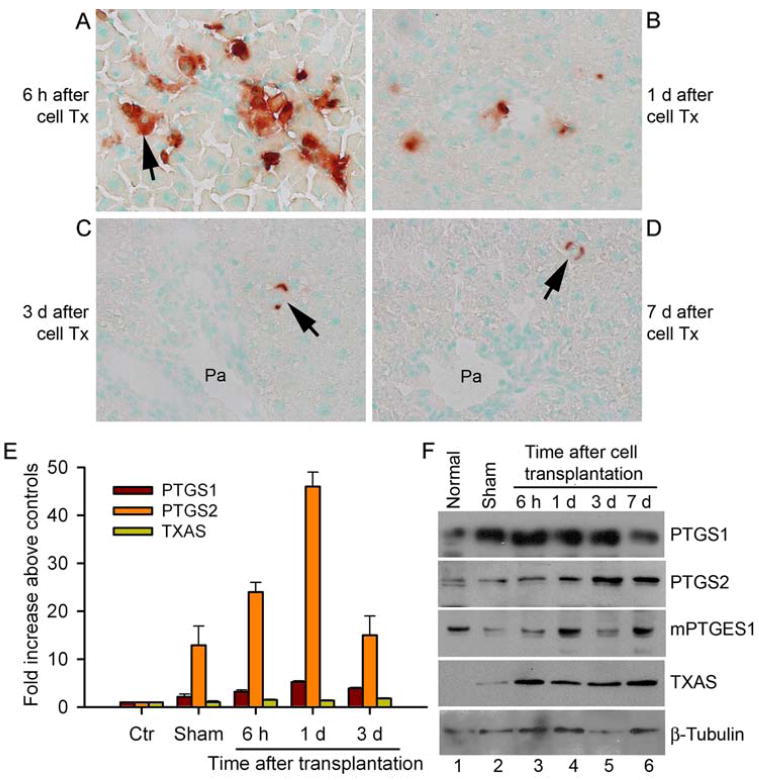
Figure 1. Cell transplantation and perturbations in cyclooxygenase pathways.

(A-D) Histochemical staining for DPPIV showing transplanted cells (arrows, red color) in the liver 6 h, 1 d, 3 d and 7 d after transplantation. Note transplanted cells in sinusoids and portal radicles after 6 h show diffuse membranous staining of DPPIV (A). By contrast, fewer transplanted cells were present at later times (B-D), and DPPIV staining was linear after 3 d and 7 d (arrows, C, D), indicating transplanted cells had integrated in liver parenchyma. Orig. mag. x400; methylgreen counterstain; Pa = portal area. (E) Real-time quantitative RT-PCR data showing changes in expression of PTGS1, PTGS2 and TXAS genes compared with untreated control animals and sham-treated animals as indicated. Expression of PTGS2 mRNA increased most. (F) Western blots showing protein analysis. Lane 1, unmanipulated normal liver; lane 2, sham-operated liver; lanes 3-6, livers after hepatocyte transplantation.
