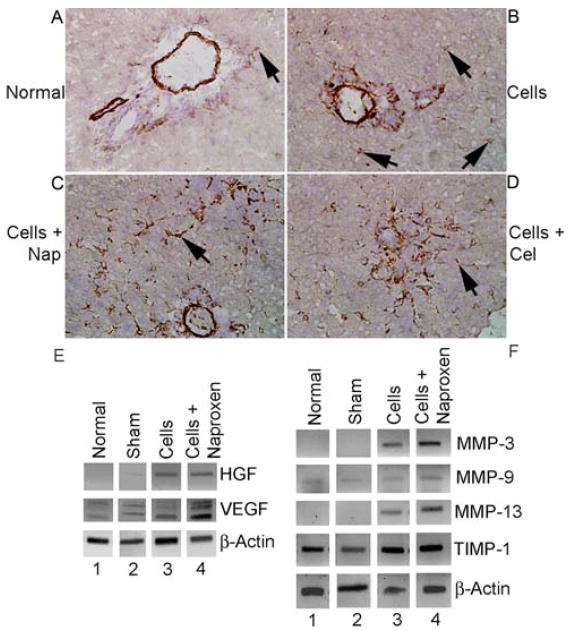
Figure 6. Desmin staining to identify HSC.

(A) Shows normal untreated rat without cell transplantation with desmin staining in major vessels in portal area as well as occasional desmin-positive HSC (arrow). (B) Shows rat 3 d after cell transplantation with interspersed HSC in periportal area (arrows). (C and D) Show rats 3 d after cell transplantation with 6 mg/kg naproxen or 40 mg/kg celecoxib with extensive increases in desmin-stained HSC. Orig. mag. x400; hematoxylin counterstain. (E) RT-PCR showing expression of HGF and VEGF mRNAs 3 d after cell transplantation with and without 6 mg/kg naproxen. Lane 1, untreated control liver; lane 2, cell transplantation alone; lane 3, cell transplantation after naproxen. (F) RT-PCR showing expression of MMP-3, -9 and -13, and TIMP-1 mRNAs. Lanes 1, 2, untreated controls; lanes 3, 4, cell transplantation alone; lanes 5, 6, cell transplantation after naproxen.
