
Figure 2.
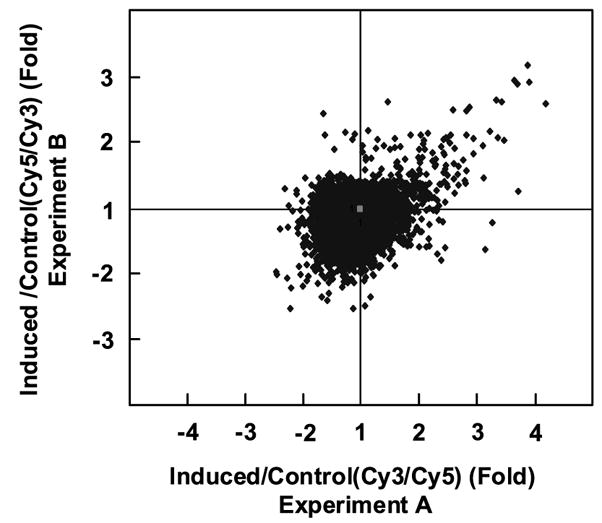
Scatter plot analysis of microarray hybridization results from experiments A and B. The signal value for each cDNA from induced cells was compared to that from control cells and expressed as a balanced differential expression value. Shown is a scatter plot of balanced differential expression values for all the genes in experiments A and B. Genes in the center of the plot have a value of 1 and are unchanged in their expression by treatment with ponasterone A. Genes in the right upper quadrants are up-regulated and those in the lower left quadrants are down-regulated in both experiments.