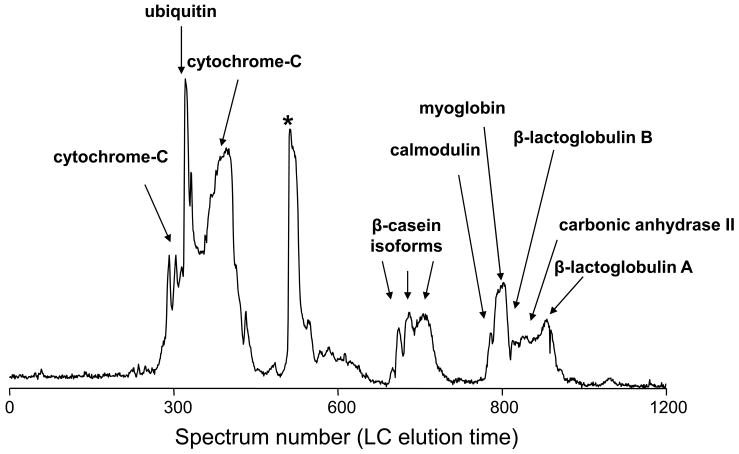
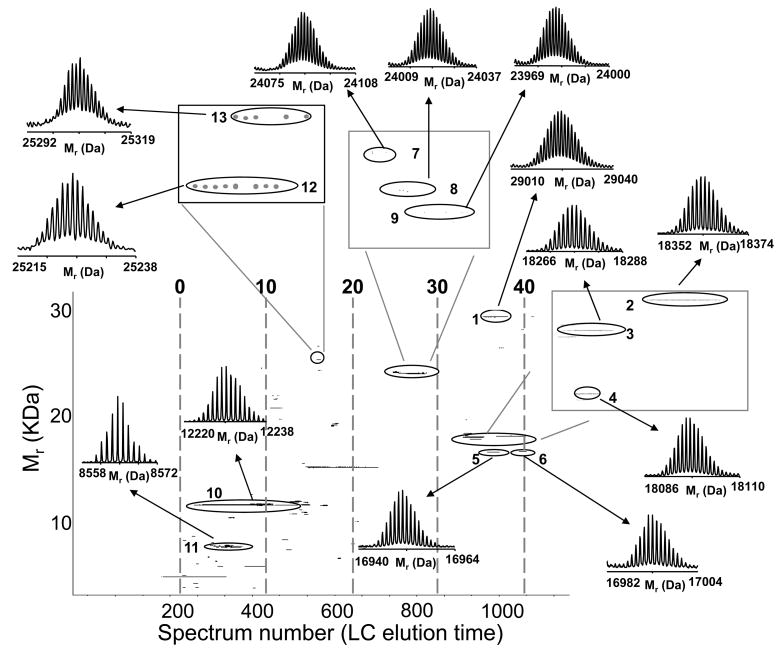
Figure 2.
Intact LC-MS analysis of a standard protein mixture: A) RPLC-FTICR MS total ion chromatogram and B) 2D display reconstructed from the LC-MS data. Proteins and modified proteins were tentatively identified (Table 2) by matching bottom-up data with the measured intact protein masses. Note that the peak labeled with * in A is assigned as a mixture of a putative myoglobin degradation fragments. The resolving power of the isotope distributions in this and Figures 5 and 9 is ~60,000. The acquired m/z data has a resolution of ~100,000. The major reduction in resolution occurs during the hyper-transform of m/z isotope isotopic distributions from multiple charge states into a single neutral charge isotope distribution.


