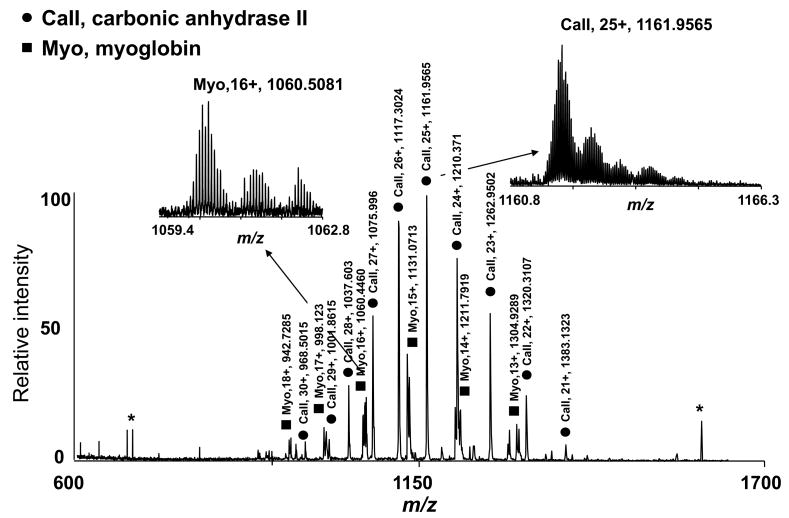
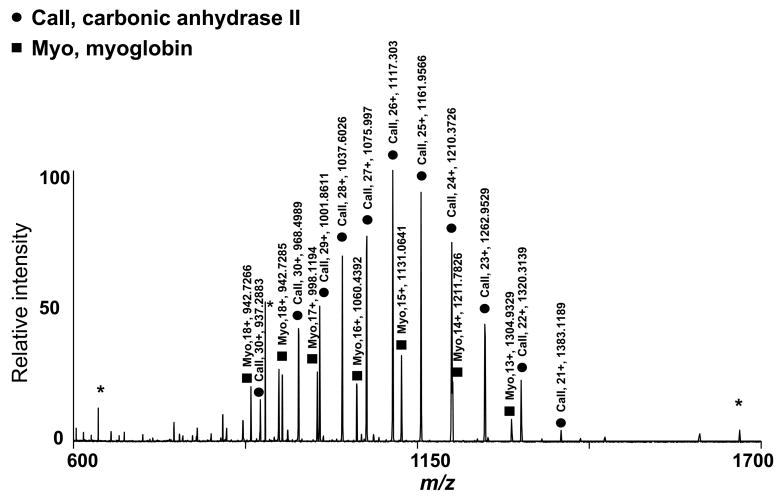
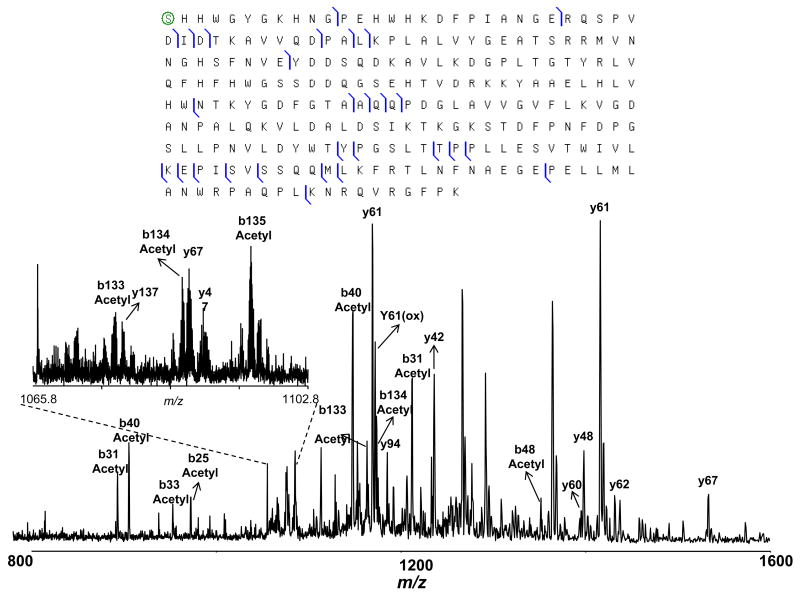
Figure 4.
Identification of carbonic anhydrase II in fraction 35. A) Mass spectrum obtained for reconstituted fraction 35; B) mass spectrum obtained by summing all of the spectra acquired online during the collection of the fraction 35; C) CID MS/MS data acquired for m/z=1161. (Note that the peaks labeled with * are noise peaks.)


