
Figure 3.
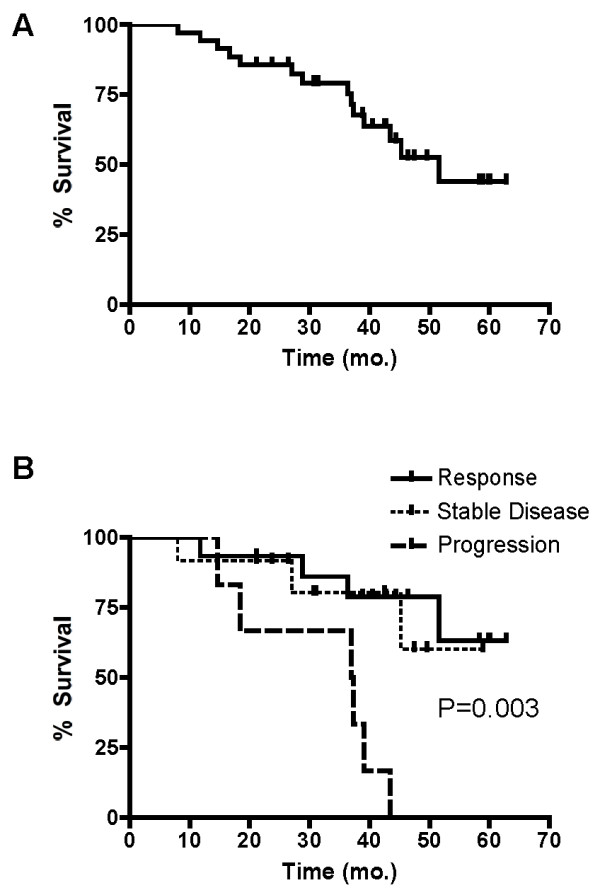
A Kaplan-Meier curve illustrating overall survival in all patients enrolled in the study. B. Overall survivals of all patients enrolled in the study as a function of response to chemotherapy.
Official websites use .gov
A
.gov website belongs to an official
government organization in the United States.
Secure .gov websites use HTTPS
A lock (
) or https:// means you've safely
connected to the .gov website. Share sensitive
information only on official, secure websites.
A Kaplan-Meier curve illustrating overall survival in all patients enrolled in the study. B. Overall survivals of all patients enrolled in the study as a function of response to chemotherapy.