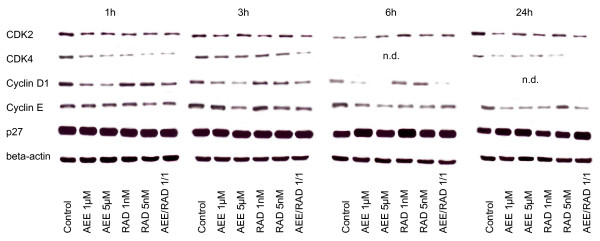
Figure 9.
Western blot analysis of cell cycle proteins, listed in methods. Synchronized A498 (Fig. 8), Caki-1 (Fig. 9) or KTC-26 cells (Fig. 10) were treated either with 1 μM or 5 μM AEE788 or with 1 nM or 5 nM RAD001, or with a 1 μM AEE788-1nM RAD001 combination. Controls remained untreated. Drugs were applied for 1, 3, 6, or 24 h. Cell lysates were then subjected to SDS-PAGE and blotted on the membrane incubated with the respective monoclonal antibodies. Beta-actin served as the internal control. The figures show one representative from three separate experiments.

