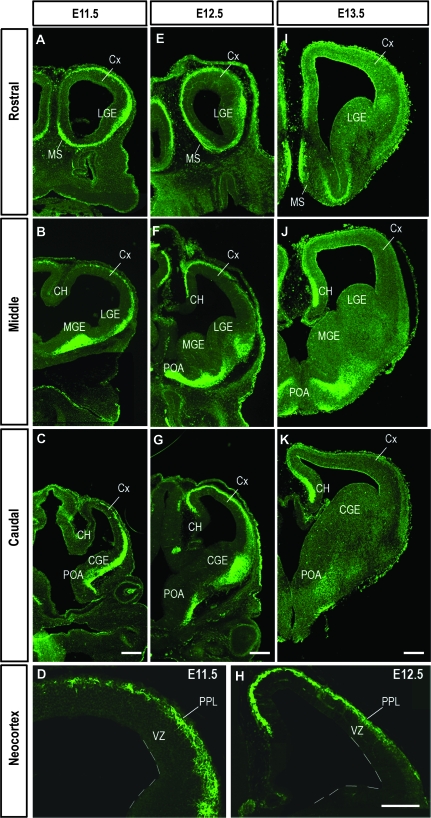
Figure 1.
Expression of Robo3 protein at rostral (A, E, I), middle (B, F, J), and caudal (C, G, K) levels of the embryonic mouse forebrain during preplate stages of development (E11.5–13.5). (D, H) Higher magnification images taken through middle levels of the cortex at E11.5 (D) and E12.5 (H). Scale bar in (C), (G), and (K) is 200 μm and applies to panels of equivalent ages; scale bar in H is 200 μm and also applies to (D) (Cx, cortex; CH cortical hem).

