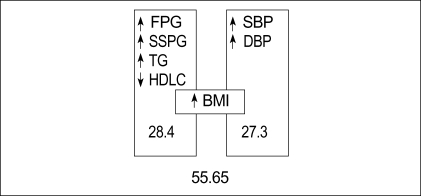
Fig. 4.
A diagrammatic representation of factor analysis performed in study subjects. FPG, fasting plasma glucose; SSPG, steady state plasma glucose; TG, triglycerides; HDLC, high density lipoprotein cholesterol; BMI, body mass index; SBP, systolic blood pressure; DBP, diastolic blood pressure. ↑, positive loading; ↓, negative loading. The numbers shown are the percentage of explained variance of either each factor or the sum of the factors.

