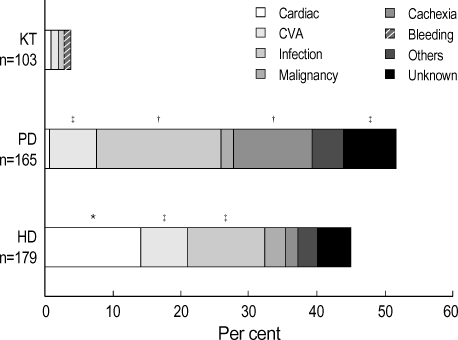
Fig. 2.
The causes of death according to modality of renal replacement therapy (RRT). The proportions from each RRT represent the mortality ratios within relevant RRT group and the each segment within RRT represents the individual cause of death. While the proportion of cardiac cause in hemodialysis was higher than that of the other two groups significantly (p<0.05), the proportions of infection and cachexia in peritoneal dialysis were higher than that of the other two groups significantly (p<0.05). CVA, cerebrovascular accident. *: p<0.05, compared with PD and with KT; †: p<0.05, compared with HD and with RT; ‡: p<0.05, compared with KT. HD, hemodialysis; PD, peritoneal dialysis; KT, kidney transplantation.

