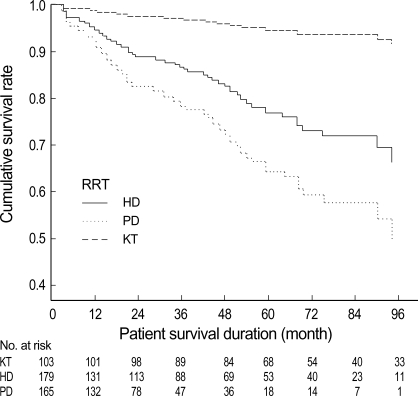
Fig. 3.
Adjusted Cox survival curves according to renal replacement therapy. It was adjusted for age, diabetes, more than one time of hospitalization caused by malnutrition, cerebrovascular accident at the initiation of renal replacement therapy (RRT), which were analyzed to be independent predictors of death by time dependent Cox regression. The patient's survival rates were significantly different among groups. The KT group showed the best survival rate over the entire follow-up period and the PD group showed the lowest survival rate. KT, kidney transplantation; HD, hemodialysis; PD, peritoneal dialysis.

