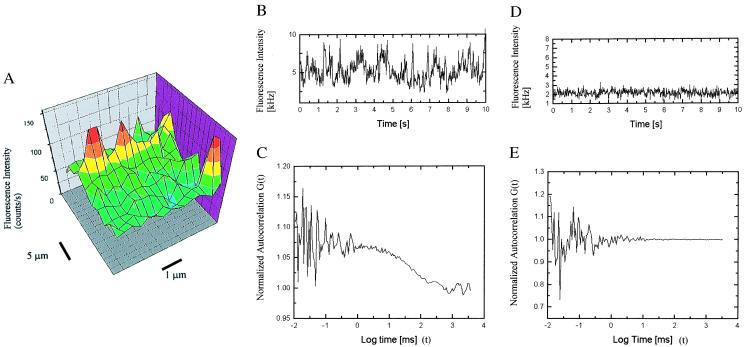
Figure 2.
(A) A surface scan provides a fluorescence image of single enzyme molecules. (B and C) The signature of a single enzyme performing catalysis is that of fluctuations in the intensity trace (B) combined with a clear signal in the autocorrelation function (C). (D and E) A control experiment in which no enzyme is present (but with everything else held constant) shows only background signal in the intensity trace (D) and no autocorrelation signal (E).

