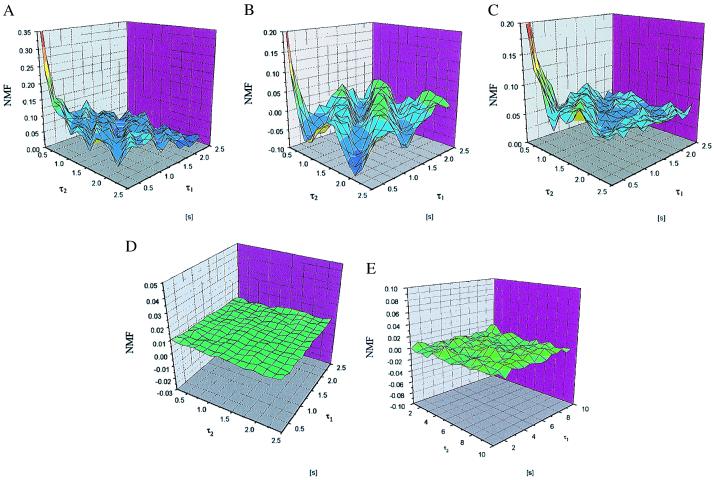
Figure 3.
Memory landscapes (ML) are shown for three molecules observed for 110 s in A, B, and C. The standard deviation of the mean for each point in the ML was calculated.† The relative errors are less than ±3%, ±4.5%, and ±3% for all points in the ML in A, B, and C, respectively. (D) A ML generated from measurement data for the case when no enzyme is present (110-s measurement time). (E) ML as generated from simulated data of a two-state Markovian process (110-s simulation time).

