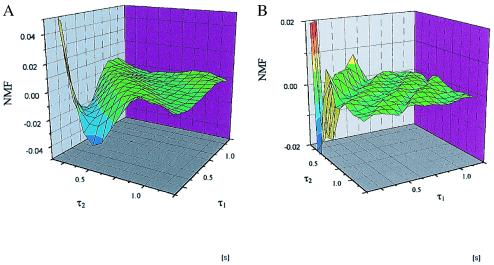
Figure 4.
ML are shown for two cases of simulations using Scheme 1 in A and B (500,000 data points simulated equaling 11,000-s measuring time). The rate constant k is set to 10 s−1 in A and 22 s−1 in B. The rate constants k−1 and k1 are always set to 20 and 15−1, respectively. The bin size is set to 20 ms in accordance with the experimental conditions.

