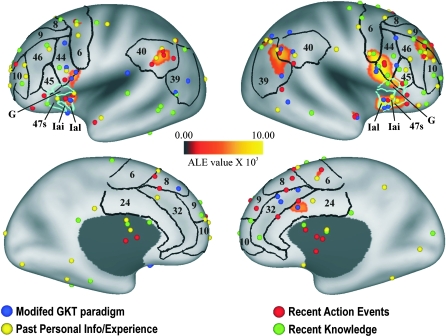
Figure 1.
Previously reported foci demonstrating greater activation for deceptive responses (i.e., lies) as compared with truthful responses overlaid on the results from the ALE meta-analysis. ALE data were thresholded at a value of 0.00502 (which corresponds to p < 0.05 False Discovery Rate corrected). Foci were projected by study-specific stereotaxic projection to the PALS-B12 atlas surface (see Materials and Methods) and are viewed on the inflated PALS atlas surface (Van Essen 2005), color coded based on paradigm type/content. The upper and lower panels show foci in relation to lateral and medial views of the average fiducial surface, respectively. Selected classical Brodmann areas (black borders) as well as orbitofrontal areas (light blue borders) from Öngür et al. (2003) are also illustrated. On all surfaces, foci are shown “pasted” to the surface, irrespective of whether their 3D coordinates lie above or below the surface.

