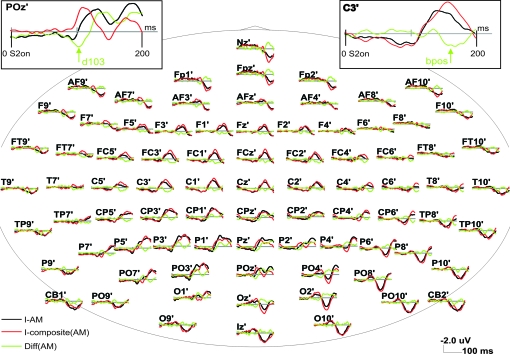
Figure 5.
Grand Average VEPs in experiment I: I-AM condition and sum of VEPs from the corresponding control conditions. VEPs are displayed using BESA's standard 81 electrode system in a pseudo topographical arrangement. The grand average was performed after resampling the interpolated scalp voltage topographies of individual subjects’ 63 electrode recordings to BESA standard 81 electrodes. VEPs were filtered between 0.5 and 100 Hz and are presented after onset of the second stimulus in the AM sequence (t = 0 ms). (I-AM, black)—VEP evoked by the AM stimulus. (I-composite(AM), red)—the composite VEP in the control stimulus conditions. (Diff(AM), green)—the SSDW. (Small insert, upper left) enlargement of these VEPs at electrode POz, which showed the largest peak in the SSDW in the time window from 90 to 110 ms (denoted d103). (Small insert, upper right) enlargement of the VEPs at electrode C3, which showed the highest peak amplitude in the later bilateral positivity of the difference wave (denoted bpos).

