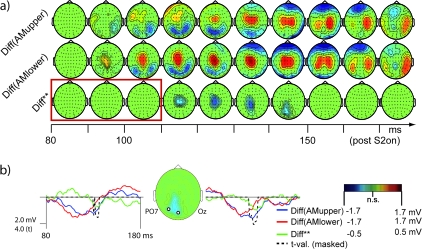
Figure 8.
Scalp topographies of the SSDWs and the effect of a shifted retinal position of the stimuli in the interval 0- to 180-ms post S2. (a) Nonsignificant electrode/time pairs are marked in green, significant electrode/time pair clusters (P < 0.05) are displayed according to their corresponding scalp voltage. From top to bottom: Diff(AMupper)—Difference between VEP in the condition II-AMupper and the summed VEP of the corresponding control stimuli (II-U-S1 + II-M-S2). Diff(AMlower)—Difference between VEP in the condition II-AMlower and the summed VEPs of the corresponding control stimuli (II-M-S1 + II-U-S2). Diff**—Difference of the SSDWs: Diff**=(Diff(AMupper) − Diff(AMlower)). Significant electrode/time pair clusters of this difference Diff** indicate that a part of Diff(AMupper) and Diff(AMlower) is susceptible to shifts in the retinal position of the stimuli and that this part of the SSDWs arises from retinotopically organized cortex, presumably with quarter field representations (confer Figs 2, 9). Note that this significant difference, especially its positive peak were well localized in time between 110 and 150 ms indicating a transition of processing through retinotopically organized cortices, that started to cease at the later stages of our analysis interval. The red box indicates the time interval where SSDWs had been susceptible to the manipulation of motion energy in experiment I (conf. Fig. 7). Note that this part of the difference waves was not susceptible to a retinal shift of stimulus position, indicating that the early, motion energy sensitive part of the SSDW arises from a piece of cortex with no or a nondiscernible retinotopic organization (like hMT/V5+). (b) Difference waves for the 2 conditions Diff(AMupper) (blue), Diff(AMlower) (red), the difference of differences Diff** (green) and the cluster corrected t-statistics (black, dashed) at 2 electrode locations over early visual cortices: electrode POz and PO7. The time range (80–180 ms) is identical to the one presented in (a). The tvalues (dashed black line) are masked by statistical significance in the same way as the maps in (a). The inserted map shows the sample electrode locations and data from condition Diff** averaged from 130 to 160 ms.

