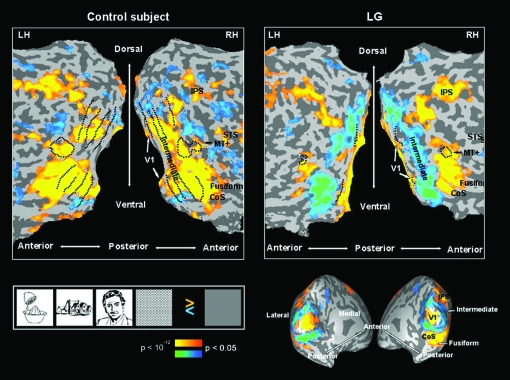
Figure 2.
Visual activation: LG versus control. Left: typical control subject; right: LG, flattened and inflated cortical sheet. Yellow to orange represent visually activated voxels compared to fixation baseline, blue to turquoise represent visually deactivated voxels compared to fixation baseline. V1, primary visual area; CoS, colateral sulcus; IPS, intraparietal sulcus; STS, superior temporal sulcus; MT+, middle temporal motion-sensitive region. RH, right hemisphere; LH, left hemisphere. Black dotted lines represent retinotopic borders and MT+ border (defined in separate experiments for each subject).

