Figure 6.
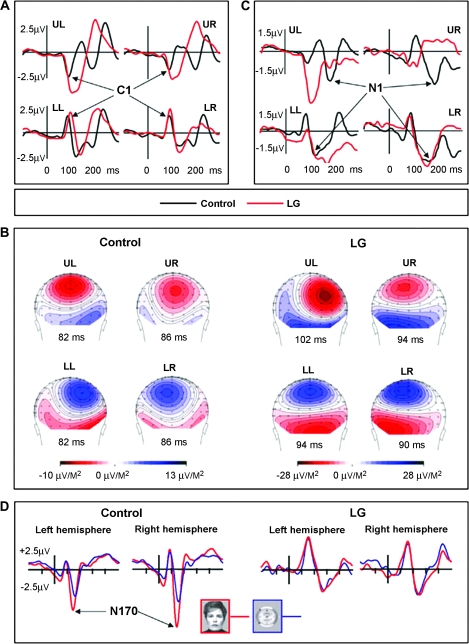
VEP and N170: LG versus controls. Electrophysiological activity elicited by LG's visual system and controls at different hierarchical levels. (A) V1-related C1 component: VEPs with sources in the calcarine cortex recorded at the parieto-occipital midline site (POz) in response to stimuli presented separately in the upper left (UL), upper right (UR), lower left (LL), and lower right (LR) quadrants of the visual field (Di Russo et al. 2002) (see Methods). The C1 latencies were delayed in LG relative to the controls (see Results for details). (B) Scalp current density (SCD) distributions at the peak of C1 elicited by stimulation in each of the four quadrants of the visual field. The sources and the sinks of the C1 dipole sources are typical for LG (right panel) and for controls. The larger amplitudes recorded in LG reflect the difference between the average of two very similar patterns within subject relative to the average of 6 participants in the control group. (C) The extrastriate N1 components recorded at right and left parieto-occipital sites (PO6 and PO5) (VEP experiment). The waveforms presented were recorded contralateral to the stimulated hemifield. Note the complete absence of N1 across hemifields for upper quadrants stimulation. (D). The high-order associated N170 component recorded at the lateral posterior-temporal sites (P9 and P10) in response to faces and watches. Note the absence of any N170-effect (that is, no special sensitivity to faces) in LG compared with the prominent normal N170-effect in the control group.

