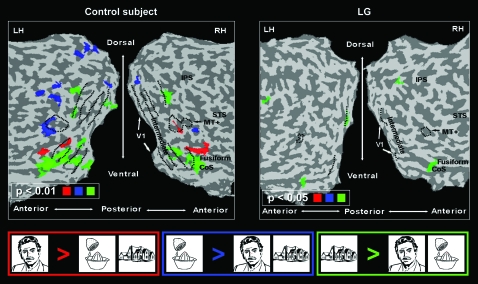
Figure 7.
Category selectivity in high-order cortex: LG versus control. Left, typical control subject; right, LG. Same presentation format and anatomical landmarks as in Figure 2. Red represents face-selective regions; green, house selective; blue, object selective.

