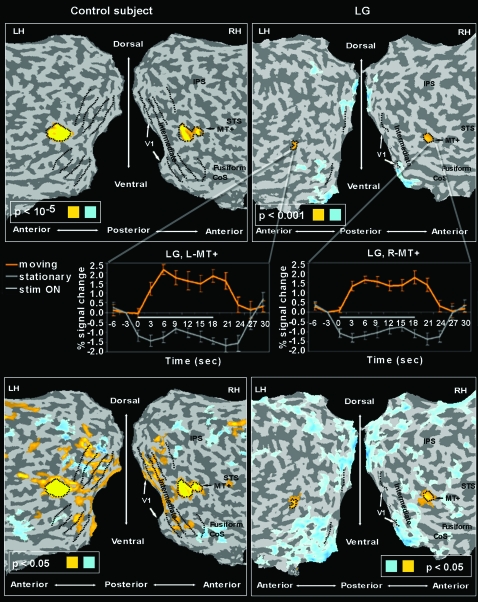
Figure 8.
Motion sensitivity in LG versus control. Same presentation format and anatomical landmarks as in Figure 2 (LG, right, control, left). Yellow indicates motion-sensitive voxels (test: motion > static; Hasson et al. 2003), light blue indicates static preference (static > motion). Motion sensitivity was found in LG in the expected MT+ location (top panels maps set at high threshold). These maps at high threshold indicate the MT+ ROI definition. At lower threshold, however, this motion sensitivity in LG did not expand beyond MT+, as typically found in controls (bottom panels maps set at lower threshold). The average time courses of LG's right and left MT+ (as sampled from the motion-selectivity experiment) are presented in the mid pannels (orange indicates response to motion blocks, gray indicates response to static blocks).

