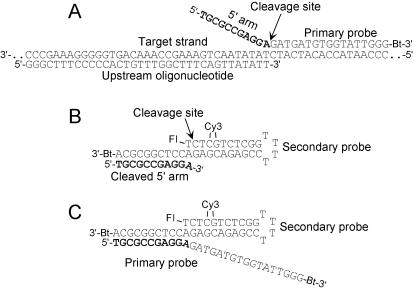
Figure 1.
Schematic representations of the serial invasive signal amplification reaction (SISAR). (A) Proposed secondary structure of the overlapping substrate of the primary reaction. The upstream oligonucleotide and the primary probe are bound with the target strand so that the 3′ terminal nucleotide (T) of the upstream oligonucleotide overlaps with the terminal A-T base pair of the duplex formed between the probe and the target. The arrow indicates the site of cleavage, which generates a cleaved 5′ arm (shown in bold) that contains one nucleotide of the analyte-specific region (A) bearing a 3′-OH. (B) Proposed secondary structure of the overlapping substrate of the secondary reaction. The cleaved 5′ arm, produced in the primary reaction, forms an invasive substrate with target and probe strands linked into a hairpin structure called the secondary probe. Fl and Cy3 dyes, forming a FRET pair, are denoted by Fl and Cy3, respectively. Bt denotes a biotin modification. The arrow indicates the cleavage site. (C) The X-structure formed by the uncut primary probe and the secondary probe, which contributes to the background of the reaction (see text).

