
Figure 11.
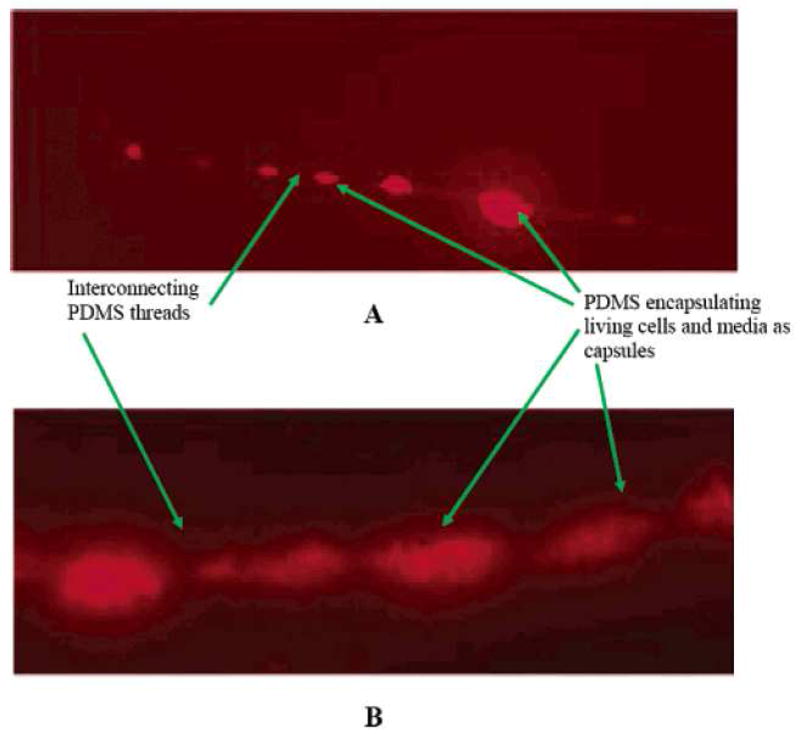
Characteristic fluorescent micrographs showing the variation in fiber diameter that results from cell encapsulation. Flow rate conditions: (A) cell suspension, 10−12 m3/s, polymer solution, 10−11 m3/s; (B) cell suspension, 10−8 m3/s, polymer solution 10−7 m3/s. (From Ref. [141] with permission)