
Figure 3.
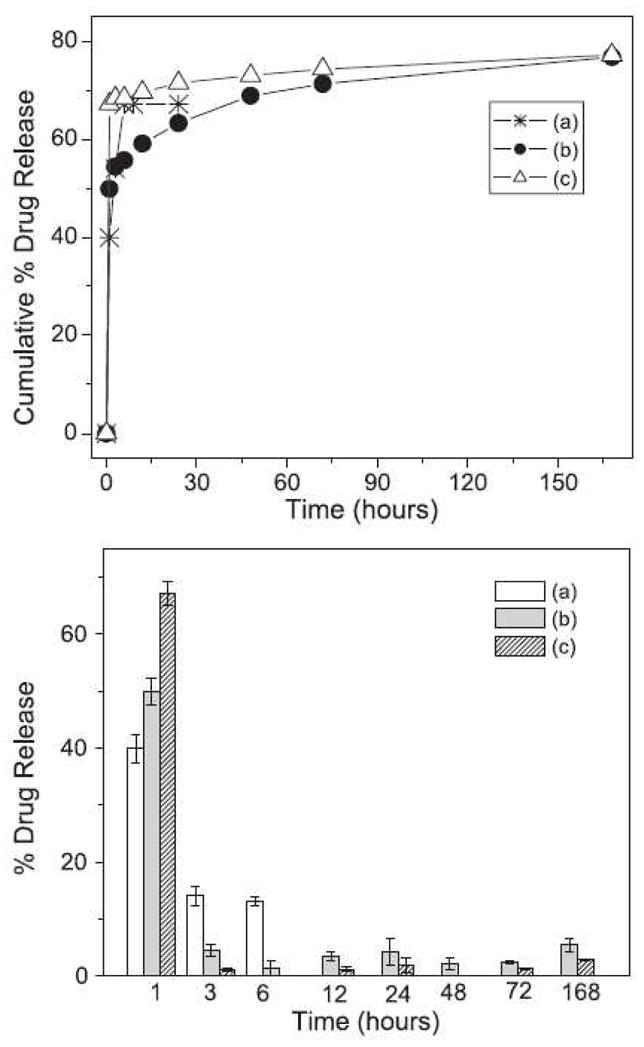
Drug (cefoxitin sodium) release profiles (cumulative curve-top and differential curve-bottom) from medicated electrospun scaffolds. The data represents the mean ± S.D. (n = 5 scaffolds): (a) medicated PLGA with 1 wt% drug, (b) medicated PLGA/PLA/PEG-b-PLA blend with 5 wt% drug, and (c) medicated PLGA with 5 wt% drug. (From Ref. [45] with permission)