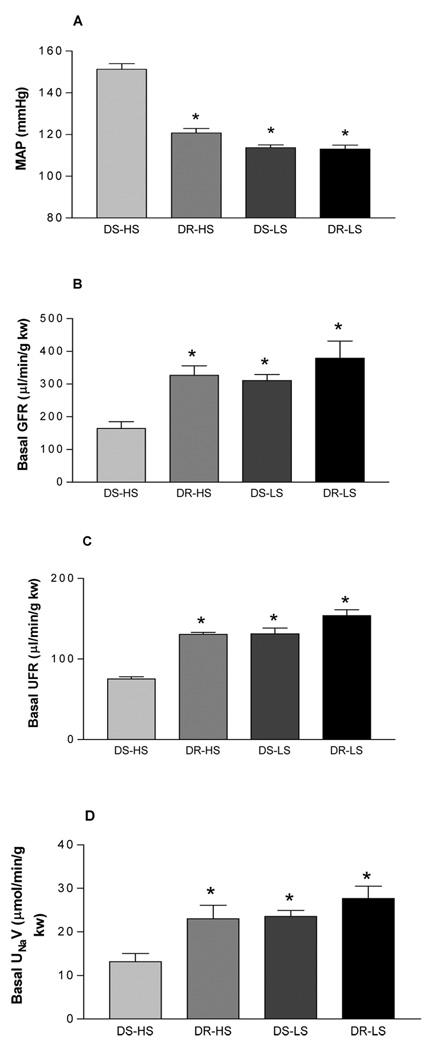
Figure 1.
Mean arterial pressure (MAP, panel A) in Dahl salt-sensitive rats fed a high salt (DS-HS) or a low salt diet (DS-LS) and Dahl salt-resistant rats fed a high salt (DR-HS) or a low salt (DR-LS) diet; basal glomerular filtration rate (GFR, panel B), urine flow rate (UFR, panel C), and sodium excretion (UNaV, panel D) in the isolated kidney perfused at a basal perfusion pressure of 95–100 mmHg. In panel A: n=16, *p<0.001 vs DS-HS. In panel B: n=5, *p<0.05 vs DS-HS. In panel C: n=5–10, *p<0.001 vs DS-HS. In panel D: n=5, *p<0.05 vs DS-HS.

