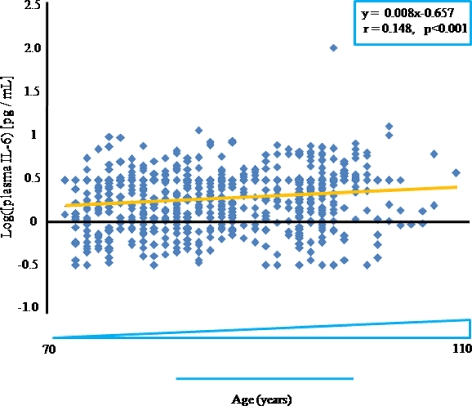
Fig. 1.
Age-related increase in circulating IL-6. Scatter-plot showing log transformed individual plasma IL-6 levels measured by enzyme-linked immunosorbent assay (ELISA). The superimposed line shows the linear interpolation, the equation and statistical data of which are reported in the box. r Correlation coefficient

