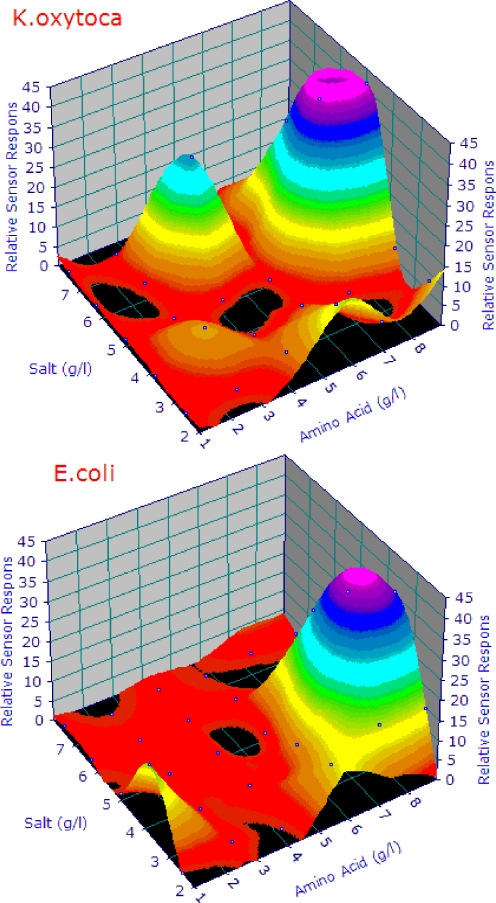
Fig. 2.
The surface plot of the maximum sensor amplitude for E. coli and K. oxytoca, as a function of the combined amino acid and NaCl concentrations. Maxima and minima are clearly shown, as is the difference in optimal concentrations for these two species. Note that the major difference is reflected by a bi-modal response curve for K. oxytoca

