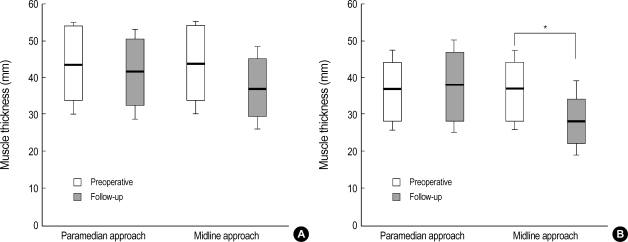
Fig. 6.
Box plot showing the postoperative changes of the thickness of multifidus muscle on the side of paramedian interfascial and midline approach. (A) male patients, (B) female patients. Box plots show the median value (horizontal line in box), and the interquartile range (25-75%) is represented by the box. *p<0.05.

