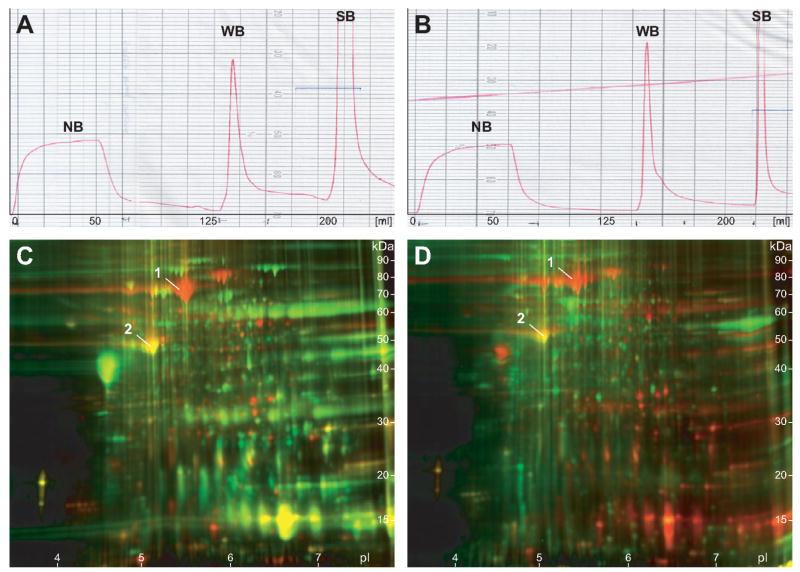
Figure 1.
Heparin affinity fractionation chromatograms and 2-D DIGE analysis of heparin affinity enrichment. (A and B) Heparin affinity chromatograms of normal (A) and adenocarcinoma (B) tissue samples from patient CA2. Samples (12 mg) of soluble total proteins extracted from colonic mucosa were loaded onto a HiTrap Heparin HP column (5 mL bed volume). Abscissa and ordinate of the chromatograms denote column elution volume and UV absorbance at 280 nm, respectively. The first broad peak corresponds to nonbinding proteins (NB). The two sharp peaks represent weakly (WB) and strongly heparin-binding (SB) proteins eluting at 200 mM and 1 M NaCl, respectively. The chromatographic profiles of normal versus disease or between different patients were overall similar to each other and reproducible without significant changes. For 2-D PAGE analysis, the peak fractions were collected and pooled to minimize small variations between runs. (C and D) Assessment of heparin affinity fractionation enrichment by 2-D Difference Gel Electrophoresis (DIGE). Total soluble proteins extracted from normal colonic mucosa (patient CA3) were separated by heparin affinity as above. Unfractionated total proteins (200 μg) were labeled with the Cy5 dye (red), while heparin-binding proteins (200 μg) were labeled with the Cy3 dye (green). Preferentially enriched proteins in weakly (C) and strongly (D) heparin-binding fractions are shown in green in the overlay images, while relatively depleted, originally abundant proteins are highlighted in red. Yellow spots identify few proteins whose abundance remains unchanged by fractionation. Note the significant increase in the number of resolved weak green spots over strong red spots, indicating the efficiency of low-abundance proteome enrichment by heparin fractionation.

