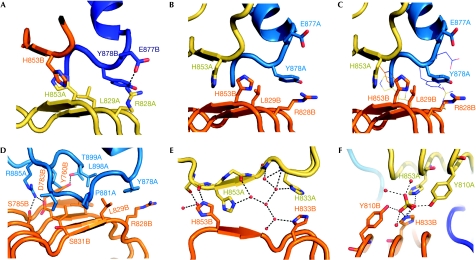
Figure 2.
Molecular interactions at the dimer interface. (A) Central region of the Slit2 D4 dimerization interface. Residues that differ in chains (A) and (B) are shown as sticks. The β-switch loop of chain (B) is coloured purple. (B) The asymmetric dimer region with the chain (A) β-switch loop is coloured purple. (C) Chain (A) and (B) superpositions. The orientation of the ribbon and sticks model is as in (B) (chain (A) on top, chain (B) at the bottom). Lines represent the alternative residue conformation in the opposite chains, as seen in (A). (D) The β-switch loop of chain (A) and interacting residues. (E) The central four-histidine cluster and water network. (F) The sulphate binding site.

