Figure 4.
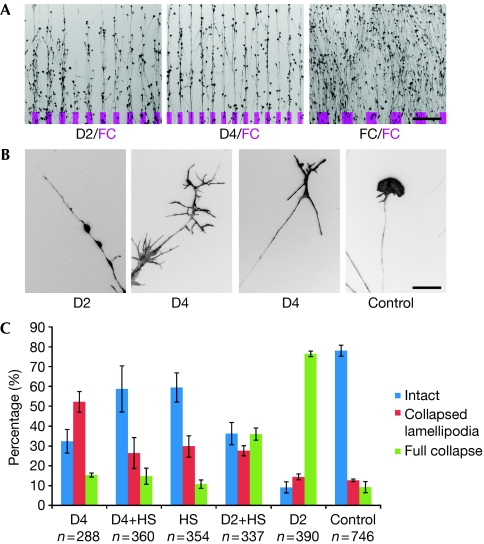
Biological activity of Slit2 contructs. (A) Stripe assay with axons given the choice between substrate-bound lanes covered with Slit2 D2, Slit2 D4 and FC compared with lanes covered with FC (indicated in magenta). Scale bar, 200 μm. (B) Representative single growth cones after treatment with soluble Slit2 D2 (full collapse), Slit2 D4 (bare branch morphology) and control treatment (intact morphology). Scale bar, 20 μm. (C) Heparan sulphate (HS) oligomers (12-mers) alter the effect of Slit2 D2 and D4 on growth cones incubated for 15 min with 100 μg/ml HS oligomers, followed by incubation for 30 min with 100 μg/ml HS oligomers and 50 μg/ml Slit2 D2 or D4, respectively. Blue bars indicate the percentage of intact growth cones, red bars indicate growth cones with bare branch morphology and green bars indicate fully collapsed growth cones. Bars indicate the s.e.m.; n indicates the number of growth cones scored.

