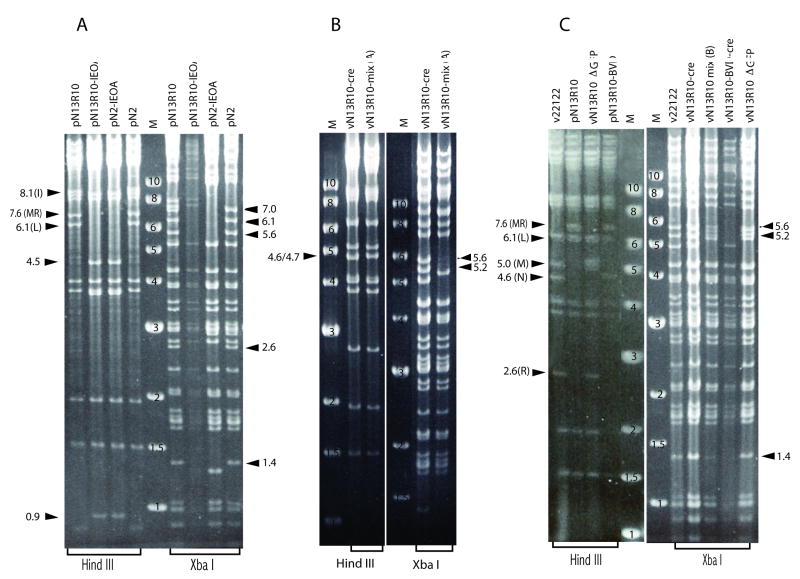
Fig. 3. Restriction pattern analyses of BACs and viral DNAs.
(A) BACs with IEOA deletions were compared to their respective parental BACs by restriction with HindIII or XbaI, separation on agarose gels, and ethidium bromide staining. (B) Virion DNA from vN13R10-mix(A) was similarly compared to vN13R10cre (reconstituted from BAC pN13R10 with BAC ori excision). (C) BAC DNAs pN13R10 and pN13R10-BVD were similarly compared to virion DNAs from the indicated viruses. Numbers on 1 kb ladder markers (M) indicate their sizes in kb. Arrows indicate the positions and sizes (in kb) of relevant restriction fragments. Letters in parentheses indicate letter designations for restriction fragments that are referred to in the text.

