
Figure 3.
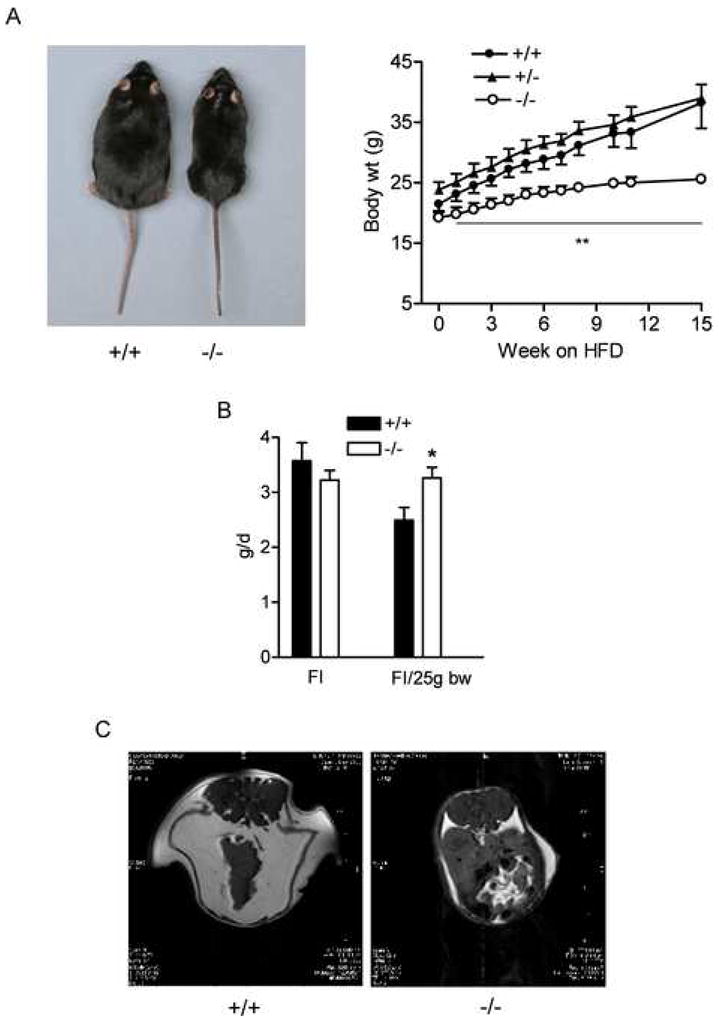
BCATm null mice are protected from high fat diet induced obesity
A) Growth curve (right panel) and representative picture of +/+ and −/− mice after high-fat-diet feeding (left panel). ** P < 0.01, −/− vs. +/+ males at each time point, n=7–8 for each group.
B) Food intake (FI) measured during high fat diet feeding. Food consumption was measured for 1 week; and average food intake was calculated and also normalized to body weigh. * P < 0.05, n=7–9.
C) Representative MRI of mice after high fat diet feeding. Transverse images set at the same distance from the anus were taken for both mice. Abdominal and subcutaneous fat shown as white was separated by the peritoneal membrane.