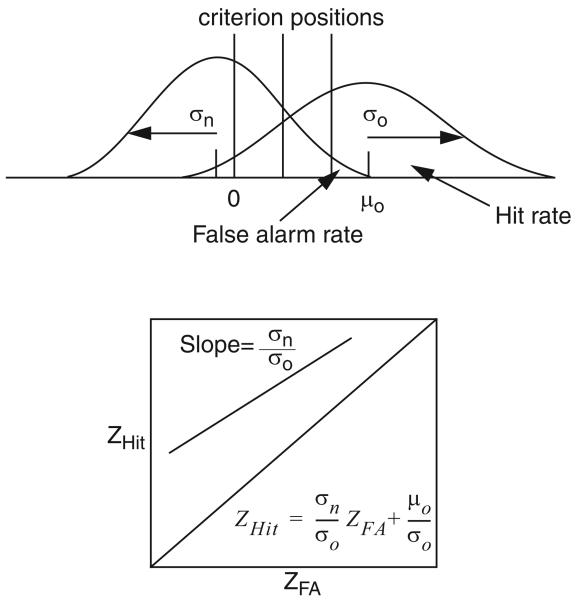
Figure 1.
An illustration of the standard signal detection model with one normal distribution for old stimuli and another for new stimuli, the z-ROC plotted from the two distributions, and the equation relating the z-transformed hit and false-alarm rates. μo is the mean of the distribution for old words and σo and σn are the standard deviations for the distributions of old and new words respectively. ZHit = z-score of the hit rate; ZFA = z-score of the false-alarm rate.

