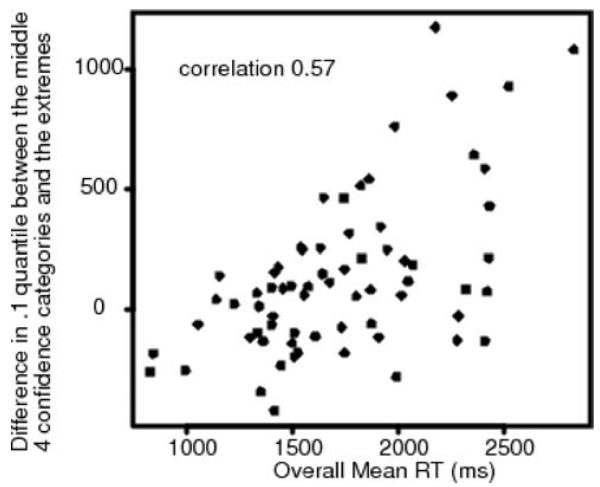
Figure 10.
A plot of the difference in the .1 quantile response times (RTs) for the two extreme (high-confidence) confidence categories and the middle four categories (lower confidence) against overall mean RT for 68 subjects from Glanzer et al. (1999) Experiments 1 and 2. A difference above zero on the y-axis means that the RTs for the middle categories are larger than for the two extreme categories.

