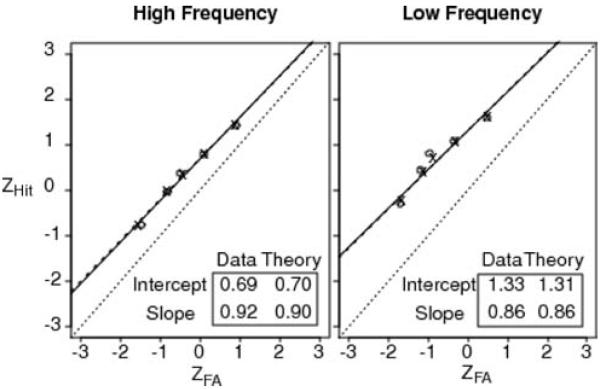
Figure 7.
z-ROC functions for the data from Experiment 1 (the data in Figure 6). The circles are the data and the Xs are the model predictions. The diagonal dotted line is a reference with slope 1 and intercept 0. There are two straight line fits to the data and the predictions from the model (solid and dashed lines, respectively), but these coincide so they largely overlap. ZHit = hit rate z-score; ZFA = false-alarm rate z-score.

