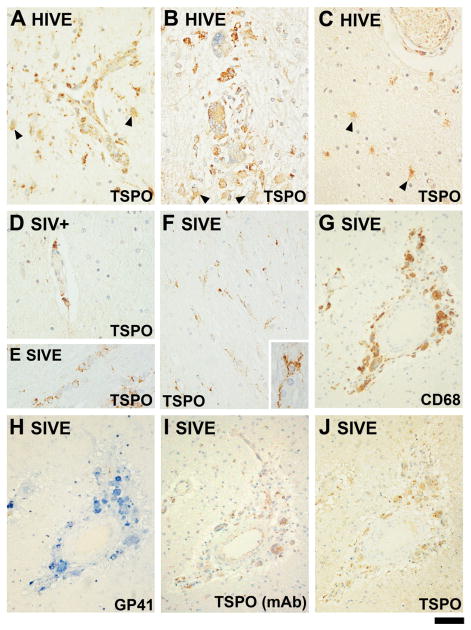
Figure 2. Expression of TSPO in HIVE and in the SIV model in macaques.
TSPO is shown in three cases of HIVE (A–C). The staining is with the pAb unless indicated otherwise. The microglial nodule shown in A is laden with TSPO+ perivascular cells and TSPO+ astrocytes are present. In all panels, TSPO+ astrocytes are indicated with arrowheads and cells were identified based on morphology. The microglial nodule shown in B is full of TSPO+ multinucleated giant cells. The area shown in (C), away from a microglial nodule, shows TSPO+ astrocytes adjacent to a vessel. (D) Perivascular TSPO+ cells are shown in an SIV+ brain without encephalitis. TSPO+ perivascular cells are also present in SIV− brain (not shown). (E) illustrates TSPO+ oligodendrocytes, based on the typical linear arrangement. (F) displays ramified microglia (based on morphology) observed throughout the parenchyma in one SIVE brain. One TSPO+ cell is shown in high power in the inset of (F). (G–J) are serial sections of the same microglial nodule stained for CD68: (G), SIV GP41 (H), the TSPO mAb (I) and the TSPO pAb (J). The scale bar represents 40 μm in A–F, 80μm in G–J and 12 μm in F inset.

