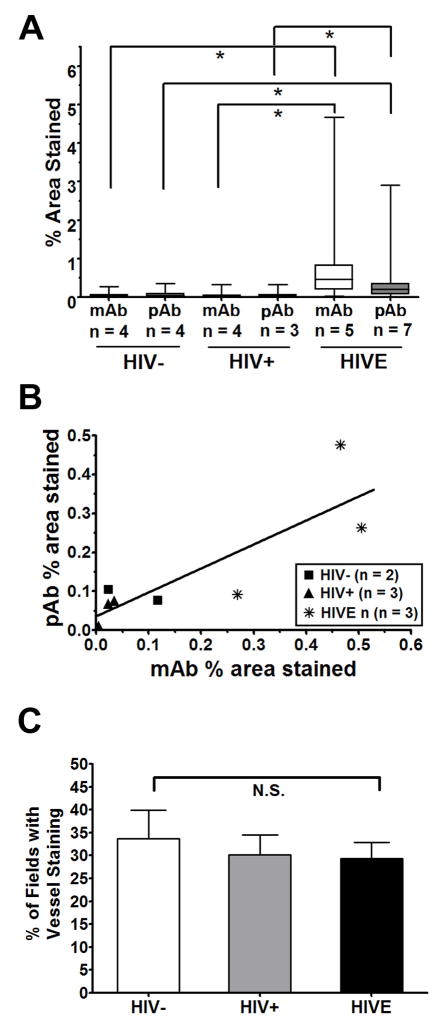
Figure 3. Image analysis of TSPO immunohistochemistry for HIVE and controls.
Image analysis of TSPO was completed for twenty 400X microscope fields of white matter per case for each antibody. (A) Staining is expressed as the percent area stained as analyzed with NIH ImageJ, as described in the Methods. The data are represented as the median ± range with the box indicating the 25th and 75th quartiles. The average percent area stained for sections immunolabeled with the monoclonal antibody (mAb, white boxes) and sections labeled with the polyclonal antibody (pAb, grey boxes) are shown. Asterisks denote p <0.001 by Kruskal-Wallis analysis of variance followed by Dunn’s multiple comparison test. (B) For cases where serial sections from the same case were available for both the mAb and the pAb (total n = 8), a Spearman correlation analysis was performed which indicated a significant correlation (p < 0.05; r = 0.83). (C) Sections stained with the mAb were analyzed for vessel staining as described in the Methods. The percent of fields where vessel staining was evident was not significantly different between HIV−, HIV+ and HIVE based on one-way analysis of variance (p > 0.05). N.S. = not significant.

