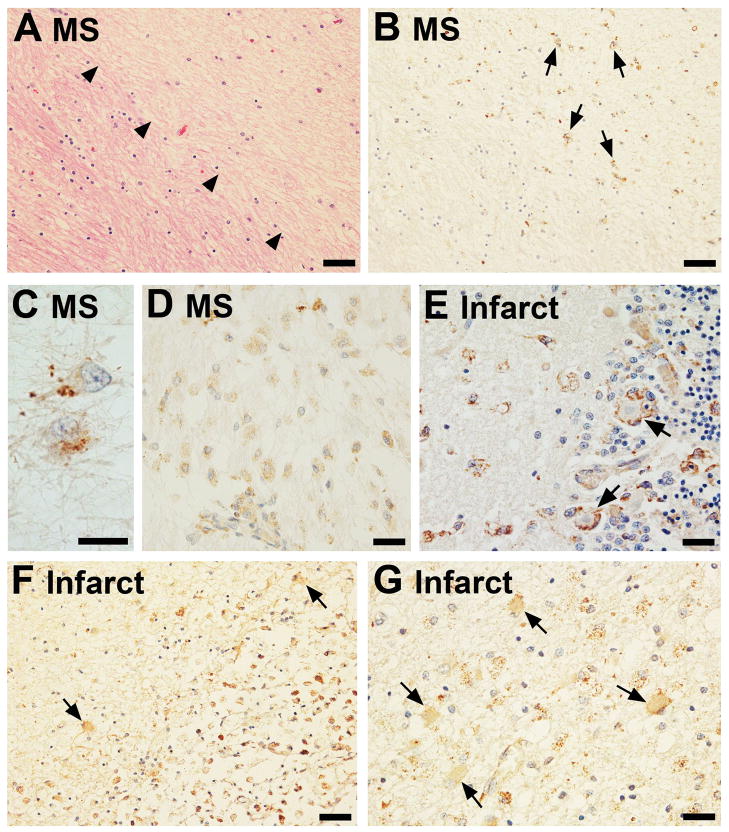
Figure 6. TSPO expression in multiple sclerosis (MS) and ischemic stroke.
An area of demyelination is demarcated by arrowheads in an MS brain (H&E, A) and the same region of this plaque shows high TSPO labeling in the demyelinated area (arrows, B) as imaged from a serial section of the same block. TSPO+ cells in the old plaque are most likely fibrillary astrocytes (shown in high power in C). In an active plaque, TSPO+ amoeboid macrophages are prominent (D). Transforming microglia around Purkinje cells display strong TSPO positivity and are observed in a sub-acute infarct (E). TSPO+ cells can be observed juxtaposed to the neurons (arrows, E). Bordering a chronic infarct were TSPO+ cells with astrocytic morphology (arrows, F, G), as well as amoeboid cells. The scale bars represent 50 μm in A, B and F; 25 μm in D,E and G; and 15 μm in C.

