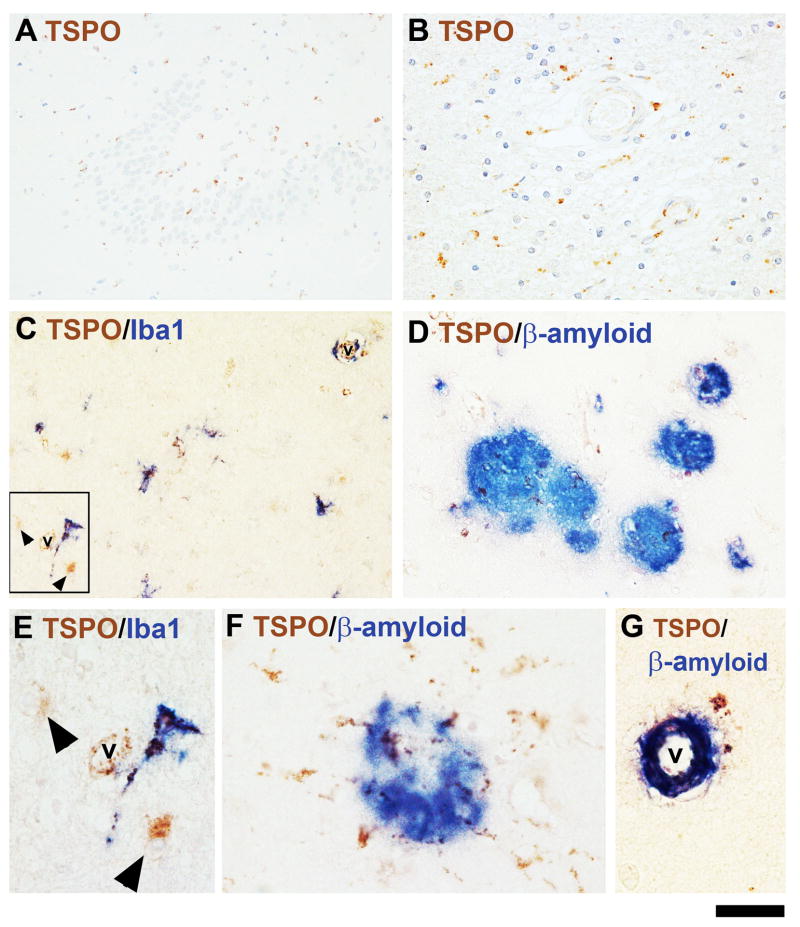
Figure 7. TSPO expression in Alzheimer’s disease (AD).
TSPO is present in glial cells sprinkled throughout the dentate gyrus and the adjacent areas (A) as well as in the hippocampal white matter (B). Glial cells expressing TSPO included Iba1+ microglial cells (C, E) as well as Iba1-negative cells, with astroglial morphology (arrows, C, E). The region in E is a high power image of the boxed region in (C). Note the dark spots within the cytoplasm (TSPO stain) of the Iba1+ ramified cell and the swollen nuclei of the astrocyte-like cells in E. TSPO+ cells were also found associating with senile plaques. Aβ+ plaques of various sizes are shown in (D) and TSPO+ glial cells radiate from one plaque (F, high power). A vessel with amyloid angiopathy was also TSPO+ (G). The scale bar represents 100 μm in A; 50 μm in B, C and D; and 20 μm in E, F and G. v = vessel lumen.

