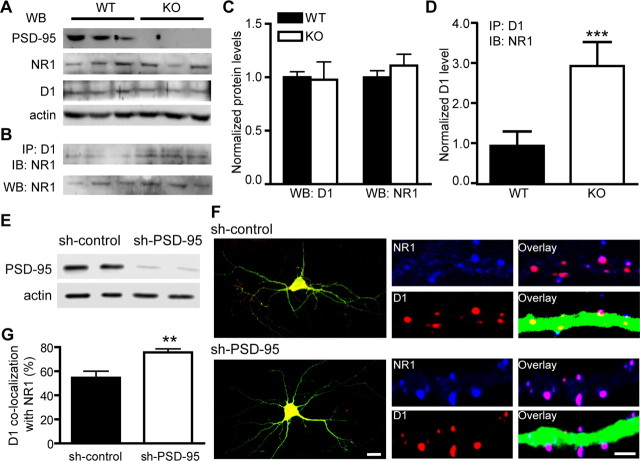
Figure 3.
Removal of PSD-95 enhances D1–NR1 association in vivo. A, Protein levels of NR1, D1, PSD-95, and actin (as a loading control) in the forebrain of PSD-95 WT and KO littermates as measured by Western blots. B, Coimmunoprecipitation of D1 and NR1 in PSD-95 WT and KO mice. Coimmunoprecipitation was performed on forebrain extracts using an anti-D1 antibody and blotted with an anti-NR1 antibody. Total NR1 levels from the same samples are shown at the bottom. C, Densitometric analyses of total D1 and NR1 levels in PSD-95 WT and KO mice. n = 7. D, Densitometric analysis of NR1 levels (background-subtracted) coprecipitated with an anti-D1 antibody. n = 8. An area with equivalent size of the NR1 band at the top of each lane was used to estimate the background signal for the lane. Results for densitometric analyses are presented in arbitrary units normalized to corresponding WT controls using the two-step normalization procedures described in Figure 2. E, shRNA silencing of PSD-95 in primary hippocampal cultures. Cultured hippocampal neurons were transfected by electroporation with sh-PSD-95 or sh-control. Protein levels of PSD-95 and actin were analyzed by Western blots. Data are representative of three independent experiments. F, Confocal images of hippocampal neurons transfected with sh-control or sh-PSD-95 shRNAs (left; scale bar, 20 μm). Merged GFP, D1 (red), and NR1 (blue) florescence is shown. Representative endogenous D1 and NR1 clusters on dendritic processes of these neurons are shown on the right (scale bar, 2 μm). G, Quantification of D1 colocalization with NR1. n = 13–30 neurons. All data are expressed as mean ± SEM. **p < 0.01, ***p < 0.001; two-tailed Student's t tests.

