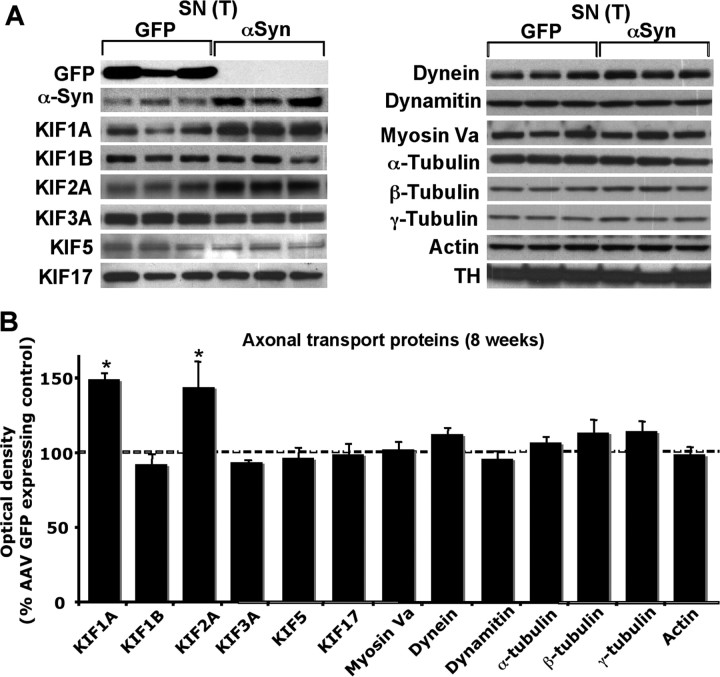
Figure 5.
Nigral changes in proteins involved in axonal transport at 8 weeks post AAV α-synuclein injection. Western blot was performed using total lysate (T) of the SN to measure levels of protein involved in axonal transport. Levels of KIF1A and KIF1B were increased in the α-synuclein overexpressing SN. Optical densities of the individual bands were quantified using NIH ImageJ. Optical densities of α-synuclein overexpressing conditions were normalized by the averaged value of GFP expressing condition. Data are shown as mean ± SEM (AAV GFP, n = 4∼6; AAV A53T α-synuclein, n = 4∼6; *p < 0.05 two tail t test).

