
Figure 11. Birthdate analysis of EGFP+ neurons in the olfactory bulb, hippocampus and cortex of I12b-Cre;Z/EG and URE2-Cre;Z/EG mice.
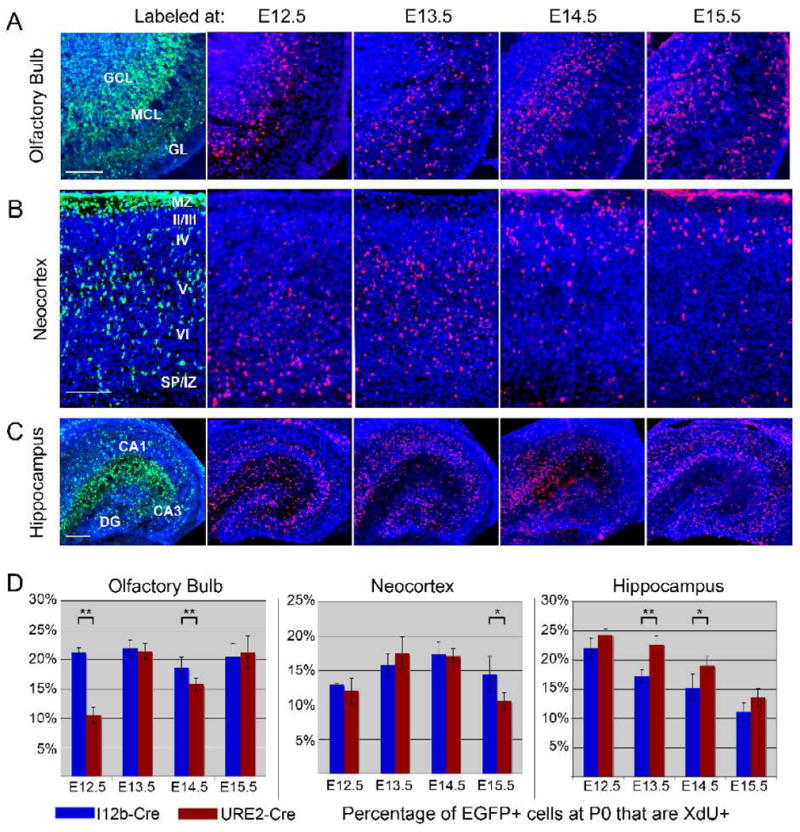
(A-C) Pregnant I12b-Cre;Z/EG and URE2-Cre;Z/EG dams were treated with thymidine analogs CldU or IdU (collectively labeled as XdU) at gestational day 12.5, 13.5, 14.5, or 15.5. Pups were collected at birth and coronal sections through the olfactory bulb (A), neocortex (B) and hippocampus (C) were double labeled for EGFP (green) and XdU (red). A representative image of EGFP expression is shown in the first column and XdU-labeling of each treatment timepoint shown in the right four columns.
(D) Quantification of the percentage of EGFP+ cells that co-expressed XdU at P0 in the olfactory bulb (left graph), neocortex (middle graph), and hippocampus (right graph). At least 3 coronal sections from 3-4 animals were analyzed. Each bar represents the mean and error bars are the SEM. * p < 0.04; ** p < 0.008.
Scale bar in A, B = 100 μm; C = 200 μm.