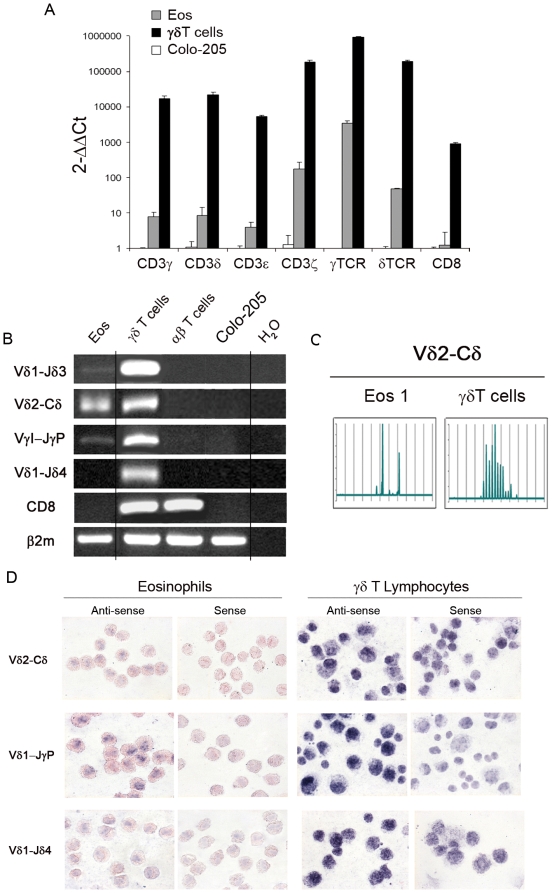
Figure 5. γδTCR/CD3 complex expression and rearrangements in human peripheral blood eosinophils.
(A) Real time PCR analysis of expression of individual chains from γδTCR/CD3 complex in eosinophils, γδ T cells and Colo-205 cells. Average expression in Colo-205 cells is chosen as reference (samples were analysed in triplicate using primers listed in Table S1). (B) TCRγ and δ rearrangements in peripheral blood eosinophils analysed by RT-PCR using primers listed in Table S2. CD8 amplification is performed to exclude lymphocyte contamination. Colo-205 are chosen as negative control (C) Spectratyping analysis of CDR3 length profiles for Vγ9-Jγ1/2 ; Vγ9-JγP and Vδ2-Cδ families in eosinophils and in γδ T cells from the same donor. (D) Expression of rearranged γ and δTCR at the single cell level in peripheral blood eosinophils and γδT cells detected by in situ hybridization using anti-sense and control sense probes specific for Vδ2-Cδ, VγI-JγP and for Vδ1-Jδ4 used as negative control.

