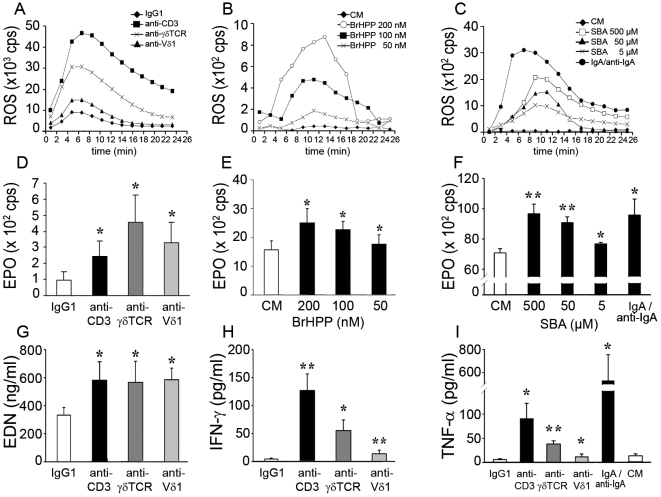
Figure 7. Specific mediator release upon CD3- or γδTCR-induced eosinophil activation.
(A–C) Representative time course of ROS production following eosinophil activation by immunobilized specific antibodies (A), BrHPP (B) or SBA stimulation (C). (A) Stimulation with immobilized anti-CD3 (▪), anti-γδTCR (X) or anti-Vδ1 (▴) mAbs or control IgG1 (♦). (B) Stimulation by BrHPP 200 nM (○) 100 nM (▪) and 50 nM (◊) or culture medium (♦). (C) Stimulation by SBA 500 µM (□) 50 µM (▴) and 5 µM (X), culture medium (♦) or IgA/anti-IgA immune complexes (•). (D–F) EPO release by eosinophils upon CD3 or γδTCR activation by specific antibodies (D) (n = 6), BrHPP (E) (n = 3) or SBA stimulation (F) (n = 3). Results are expressed in count per second (cps). (G) EDN release by eosinophils upon CD3 or γδTCR activation by specific antibodies (n = 6). (H–I) Cytokine production by eosinophils upon CD3 or γδTCR activation by specific antibodies or IgA/anti-IgA immune complexes. IFN-γ production (H) (n = 5–7) and TNF-α production (I) (n = 4–8). Results presented in panels E and F were obtained on different patients. *, P<0.05; **, P<0.01.

