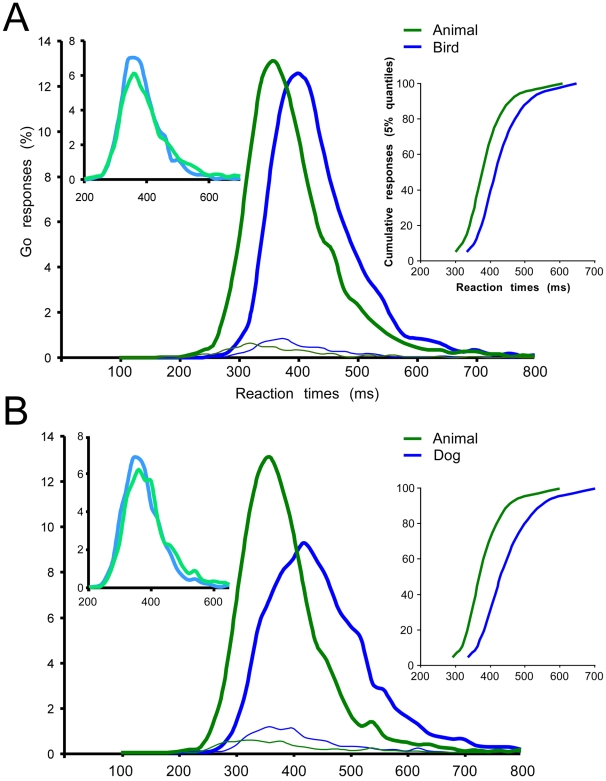
Figure 2. Reaction time distributions in the bird (A) and in the dog (B) experiments on correct (thick lines) and incorrect (thin lines) trials, calculated with 10 ms bin width.
Reaction time distributions were computed separately in the superordinate level task (green curves) and the basic level task (blue curves). A and B: left insert correspond to RT distributions within the superordinate animal/non animal task for bird (dog) animal target (blue curve) and for other animal targets (green curves); right insert: vincentization of individual results (5% quantiles) in the superordinate (green curves) and the basic level (blue curves) categorization tasks.

