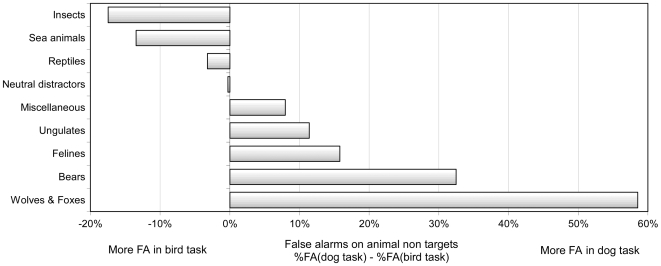
Figure 3. Comparison of false alarms elicited by different subgroups of animal non-targets depending on which animal was the “basic level” animal target.
Rate of false alarms in the bird task were subtracted from rate of false alarms in the dog task. The results, expressed in absolute value, are reported on the left when more FA were performed in the bird task and on the right side when more FA were performed in the dog task. As an example, the value of 32.5% for bears on the right side is the result of subtracting 38.5% (false alarm rate for bears in the Dog task) and 6.0% (false alarm rate for bears in the Bird task).

