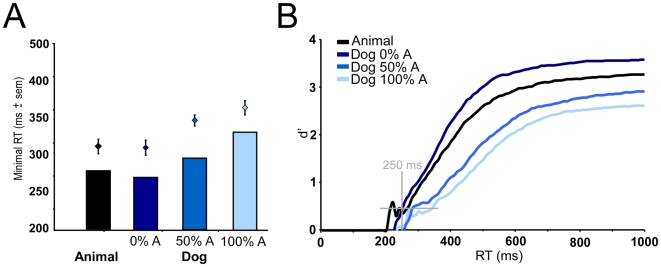
Figure 5. Performance in the superordinate categorization task (black curves and histograms) and in the categorization task at the basic level (dogs) with non-targets including 0%, 50% or 100% other animals (dark, middle and light blue curves and histograms).
A. Minimal reaction time determined as the first 10 ms time bin for which correct responses significantly exceed errors (targets and non-targets were equally likely) and processed on cumulated data (histograms) or as the mean of individual data (diamonds with standard deviation on the mean). B. Cumulative d' curves using signal detection theory sensitivity measures were plotted as a function of time with 10 ms time bins. Cumulative number of hits and false alarm responses were used to calculate dV = zhits - zFA at each time point where z is the inverse of the normal distribution function (Macmillan & Creelman, 2005). d' curves corresponding to the time course of performance give an estimation of the processing dynamics for the entire subject population. The shortest minimal reaction time shown on the left is indicated on the d' curves to draw attention on the shift of performance for the shortest “meaningful” behavioral responses.

