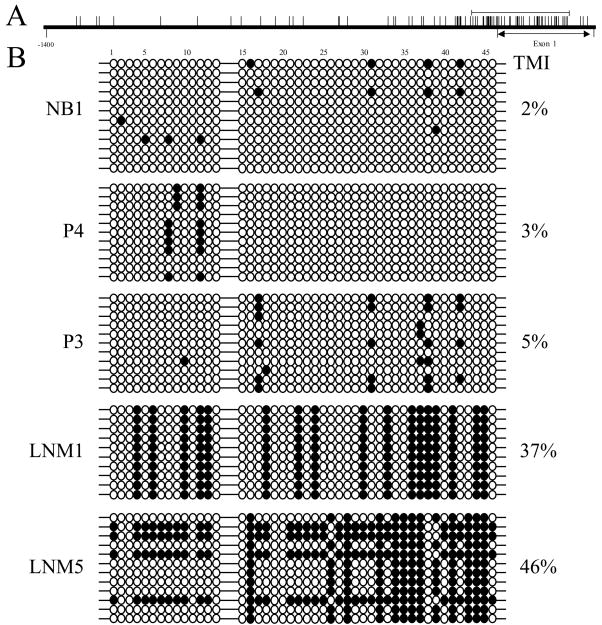
Fig. 4.
Methylation analysis of the CST6 proximal promoter and exon 1 in representative primary breast tumors and lymph node metastases. (A) The distribution of CpG dinucleotides proximal to the transcription start site in the promoter (0 to −1400 nucleotides) and exon 1 (0 to +294 nucleotides) of CST6 are depicted schematically (vertical lines indicate the relative position of individual CpG dinucleotides). Methylation analysis was performed on a region of the promoter spanning from −118 to +242 (indicated by a solid horizontal line), which contains 46 CpG dinucleotides and encompasses a large CpG island. (B) All clones analyzed for methylation of the CST6 promoter and exon 1 (46 CpGs) are shown for representative primary breast tumor and lymph node metastases examples. Black circles correspond to methylated CpGs and open circles correspond to unmethylated CpGs. TMI values for the entire promoter/exon 1 region (46 CpGs) are given for each primary breast tumor and lymph node metastases. NB1, P4, and P3 express cystatin M, while LNM1 and LNM5 lack cystatin M protein expression.

