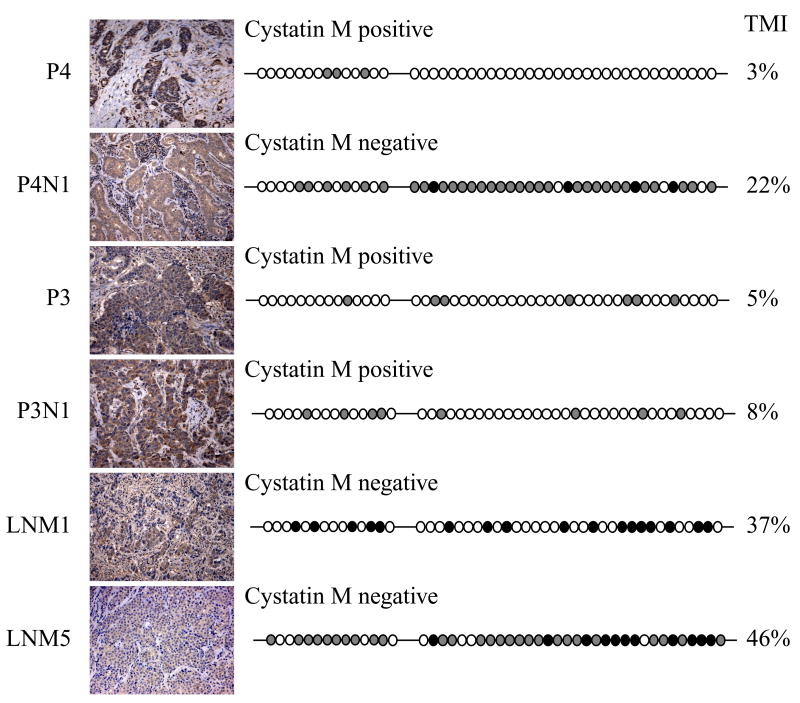
Fig. 5.
Correlation analysis of cystatin M expression and CST6 methylation status in primary breast tumors and lymph node metastases. Panels show cystatin M immunostaining (on left) and a summary of the methylation analysis of the CST6 promoter/exon 1 (46 CpGs) is show on the right. Black circles correspond to fully (100%) methylated CpGs, gray circles correspond to CpGs with intermediate methylation, and open circles correspond to unmethylated CpGs. TMI values for the entire promoter/exon 1 region (46 CpGs) are given for each tissue sample. P4 and P3 primary breast tumors, and lymph node metastasis P3N1 express cystatin M. Metastatic lesions P4N1, LNM1, and LNM5 show reduced expression of cystatin M. (Original objective lens magnification 10x).

